134DRY Performance
Author: Kirk PepperdineDate: 2006-10-08Java Version: 5Category: Performance
Abstract: As developers we often hear that performance often comes at the price of good design. However when we have our performance tuning hats on, we often find that good design is essential to help achieve good performance. In this article we will explore one example of where a good design choice has been essential in an effort to improve performance.
Welcome to the 134th edition of The Java(tm) Specialists' Newsletter. This week, I have the honour of welcoming Kirk Pepperdine as a contributing author to our newsletter. It is the first newsletter that Kirk is writing for us, and hopefully not the last. Kirk is a well known authority on the topic of Java Performance. I have listened to his talks at TSSJS and JavaZone, and have even shared the stage with Kirk in Johannesburg earlier this year.
Kirk Pepperdine is presenting his incredible Java Performance Tuning course in Greece in the week of the 23rd. On one of the evenings, I will join you for a wonderful meal at "Irene's", a little restaurant in the village of Xorafakia. Run by Irene herself, this tiny taverna cooks typical Cretan dishes and is frequented by the locals (always a good sign) and of course tourists. Come join us for an evening of good food and good company :)
And with that, I hand you over to Kirk Pepperdine.
javaspecialists.teachable.com: Please visit our new self-study course catalog to see how you can upskill your Java knowledge.
DRY Performance
Just recently I had a conversation with a colleague who had determined that String was at the root of his performance woes. Normally I am sceptical when someone tells me that String utilization is the problem. It isn't that String utilization couldn't be a problem; it is just that String is used so ubiquitously that fixing it not only time consuming, there is no guarantee that "fixing" it will improve performance. However the application in question was performing a lot of String concatenations. The resulting String was then used to perform a lookup in a HashMap. What should have been a quick performance win was going to take a lot of effort because the original developer failed to adhere to the Don't Repeat Yourself (DRY) design principle.
One of the goals in this exercise was to dispel the myth that you need to sacrifice good design or write overly complex code in order to achieve good performance. That there is wide spread belief in this myth is unfortunate because I have found that violating design principles or writing overly complex code is often the stumbling block to achieving good performance. In this case, not following DRY left the String concatenation operation and subsequent HashMap lookup scattered all throughout the application. This has two knock-on effects. The first being that any operation that is a bottleneck will be difficult to find as the scattering dilutes or hides the effect. The second is that if you are lucky enough to find that an operation is a bottleneck, you will be obliged to trawl through the code looking for every instance of that operation. Lastly what happens is that teams blindly change String operations without any evidence to say that a change would make a difference.
Fortunately my colleague had identified a single use case and that allowed me to write a focused benchmark. A benchmark in which we could explore the benefits of one strategy over another. In addition, I wanted to demonstrate how DRY would help and without hurting performance. Thus I structured the benchmark to follow that design principle.
public class Person {
  private int id;
  private final String firstName;
  private final String lastName;
  public Person(String firstName, String lastName) {
    this.firstName = firstName;
    this.lastName = lastName;
  }
  public int getId() { return id; }
  public void setId(int id) { this.id = id; }
}

import java.util.HashMap;
public class AllPersons {
  private HashMap personsById = new HashMap();
  private HashMap personsByName = new HashMap();
  public Person addPerson(String firstName, String lastName) {
    Person person = new Person(firstName, lastName);
    personsById.put(new Integer(person.getId()), person);
    personsByName.put(firstName + lastName, person);
    return person;
  }
  public Person findPersonsById(int id) {
    return (Person) personsById.get(new Integer(id));
  }
  public Person findPersonsByName(String firstName,
                                  String lastName) {
    return (Person) personsByName.get(firstName + lastName);
  }
}
As you can see, the AllPersons class provides a nice neat home for all of the needed CRUD operations. Note that the class contains two HashMaps. The second is not necessary for this benchmark but demonstrates one of the benefits of following DRY. As the queries build up you may find that you need alternative indexing schemes. Just as adding an extra index in a database, the personsByIndex Map provides that functionality. Other benefits will become apparent when we move to the second part of the benchmark. The next step was to setup a benchmark harness. The code for this is just below.
import java.util.*;
public class TestHarness implements Runnable {
  private static String[] FIRST_NAMES = {"Ted", "Fred", "Andy",
      "Gromit", "Wallace"};
  private static String[] LAST_NAMES = {"Mouse", "Duck", "Pascal",
      "Kabutz", "Monster", "Dread", "Crocket"};
  private StringArray firstNames =
      new StringArray(FIRST_NAMES);
  private StringArray lastNames =
      new StringArray(LAST_NAMES);
  private AllPersons allPersons;
  private int numberOfIterations;

  public TestHarness(int numberOfIterations) {
    this.numberOfIterations = numberOfIterations;
  }
  public void init() {
    allPersons = new AllPersons();
    for (int i = 0; i < 250000; i++) {
      allPersons.addPerson(
          firstNames.nextAsDeepCopy(),
          lastNames.nextAsDeepCopy());
    }
  }

  public void run() {
    for (int i = 0; i < numberOfIterations; i++) {
      allPersons.findPersonsByName(
          firstNames.next(),
          lastNames.next());
    }
  }

  public static void main(String[] args) throws InterruptedException {
    ArrayList processes = new ArrayList();
    ArrayList threads = new ArrayList();
    long setup = System.currentTimeMillis();
    for (int i = 0; i < Integer.parseInt(args[0]); i++) {
      TestHarness harness = new TestHarness(
          Integer.parseInt(args[1]));
      harness.init();
      processes.add(harness);
    }
    setup = System.currentTimeMillis() - setup;

    System.gc();
    Thread.sleep(1000);
    System.gc();
    Thread.sleep(1000);

    long processing = System.currentTimeMillis();
    for (Iterator it = processes.iterator(); it.hasNext();) {
      TestHarness harness = (TestHarness) it.next();
      Thread thread = new Thread(harness);
      thread.start();
      threads.add(thread);
    }
    System.out.println("waiting");
    for (Iterator it = threads.iterator(); it.hasNext();) {
      Thread thread = (Thread) it.next();
      thread.join();
    }
    processing = System.currentTimeMillis() - processing;
    System.out.println("Setup time : " + setup);
    System.out.println("Processing time : " + processing);
  }

  public static class StringArray {
    private int nextString = 0;
    private String[] array;

    public StringArray(String[] strings) {
      this.array = strings.clone();
    }

    public String next() {
      String result = array[nextString++];
      nextString %= array.length;
      return result;
    }

    public String nextAsDeepCopy() {
        return new String(next());
    }
  }
}
The harness is pretty straight forward. After doing some initialization I clear the deck to prepare for the run. The clearing consists of a pair of calls to System.gc() followed by a sleep. The reason why gc is called twice is that the second call takes care of collecting any residual objects that may have required finalization. The call to sleep removes any interference from the concurrent portion of the call to gc. With the cleanup complete, we have more assurance that we are only measuring what we believe we are measuring.
What I wanted a measure of was the effect of memory management on the time to complete a fixed unit of work. The results of the runs are listed in table below.
| Setup | Test |
|---|---|
| 25.187 | 324.32 |
| 25.328 | 327.81 |
| 25.328 | 316.73 |
There i some variation in the numbers but what is important to note is that the magnitude remains stable. During the run I made the observation that CPU utilization bounced about in the range of 77 to 89%. My guesstimate was that overall CPU utilization averaged 83%. This was a bit surprising given that the benchmark runs un-throttled but more on this later on. The next step was to implement the alternative solution. Since the key in the lookup was a composite of two String objects, what I proposed was to introduce a new class. In the source for CompositeKey we can see that the concatenation has been replaced two instance variables.
public class CompositeKey {
  private String key1, key2;
  public CompositeKey(String key1, String key2) {
    this.key1 = key1;
    this.key2 = key2;
  }

  public final boolean equals(Object o) {
    if (this == o) return true;
    if (!(o instanceof CompositeKey)) return false;

    CompositeKey that = (CompositeKey) o;
    if (key1 != null ? !key1.equals(that.key1) : that.key1 != null)
      return false;
    if (key2 != null ? !key2.equals(that.key2) : that.key2 != null)
      return false;
    return true;
  }

  public final int hashCode() {
    int result;
    result = (key1 != null ? key1.hashCode() : 0);
    result = 31 * result + (key2 != null ? key2.hashCode() : 0);
    return result;
  }

  public String getKey1() {
    return key1;
  }
  public String getKey2() {
    return key2;
  }
}
Since we followed DRY, altering the benchmark to use the new class is simple. All of our changes have been isolated to our domain specific collection class. Note that changes to the harness are missing from the code (listed below) that has been changed. This implies that we are presenting the benchmark the same unit of work offered under the same conditions. This is an important property that allows us to directly compare results.
public Person addPerson(String firstName, String lastName) {
  Person person = new Person(firstName, lastName);
  personsById.put(new Integer(person.getId()), person);
  personsByName.put(new CompositeKey(firstName, lastName), person);
  return person;
}
public Person findPersonsByName(String firstName, String lastName) {
  return (Person)personsByName.get(new CompositeKey(firstName, lastName));
}
With these changes in place I was quickly able to re-run the benchmark. The results of these runs are listed in the next table.
| Setup | Test |
|---|---|
| 20.640 | 112.000 |
| 20.750 | 111.797 |
| 20.704 | 111.719 |
As we can see there is a dramatic improvement in performance of the benchmark. As for my previous observation regarding CPU utilization, I guesstimated that the new improved version was averaging of about 95%.
From this evidence we can start to draw conclusions. The first conclusion was that abandoning String in favour of the (more suitable) CompositeKey class provided us with a stunning improvement in performance. The second conclusion was that following DRY made it extremely easy for us to alter the performance of the application. If this were all that could be said than it would be more than enough, however, since the focus of this benchmark was on the effects of memory management, garbage collection activity was monitored.
To monitor GC, the -verbose:gc JVM flag was set and the subsequent output was processed by HP JMeter. The resulting graphical display is shown in figure 1.
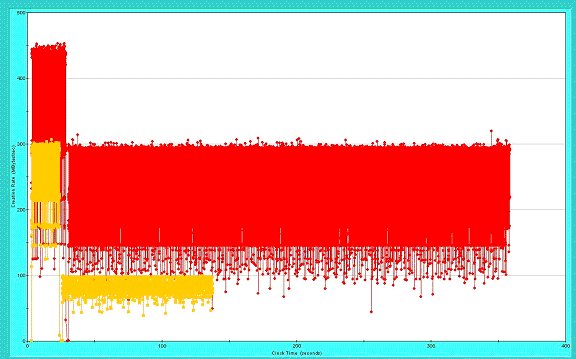
What we are looking at is a comparison of object creation rates of both the original benchmark in red and the "improved" version in yellow. From this view we can see that String version created 79,354.22 Mbytes of data where as the improved version created 14,661.595 Mbytes. I am not sure if there are any words that I can use that could add to the visual impact.
There remains yet one unexplained point in this benchmark, the differences in CPU utilization between the two. I ran the benchmark on a multi-core 3.2 GHz Pentium IV processor running Windows XP Pro. As is standard with all my machines, I have swap memory turned off. This effectively pins the JVM into memory, as there is no room for it to swap. I mention this because the inability to fully utilize a CPU is almost always attributed to disk or network I/O or some form of contention such as locking. And with that note I will provide one other clue before I leave the mystery to you to solve. Since the second benchmark also was not able to reach 100% sustained utilization there is likely more than one source of contention.
As is the case with most benchmarking exercises I find that I am once again pleasantly surprised by the results. Also both Heinz and I often talk of the benefits of DRY with a lot of hand waving. We do this in a world where it is widely believed that you must violate best practices in order to achieve good performance. Thus it is satisfying to demonstrate how helpful DRY is with a concrete example.
Kind regards,
Kirk Pepperdine
Comments
We are always happy to receive comments from our readers. Feel free to send me a comment via email or discuss the newsletter in our JavaSpecialists Slack Channel (Get an invite here)
Related Articles
Browse the Newsletter Archive
About the Author
Java Champion, author of the Javaspecialists Newsletter, conference speaking regular... About Heinz
Superpack '23
 Our entire Java Specialists Training in one huge bundle
more...
Our entire Java Specialists Training in one huge bundle
more...
Free Java Book

Java Training
We deliver relevant courses, by top Java developers to produce more resourceful and efficient programmers within their organisations.